Preview 1
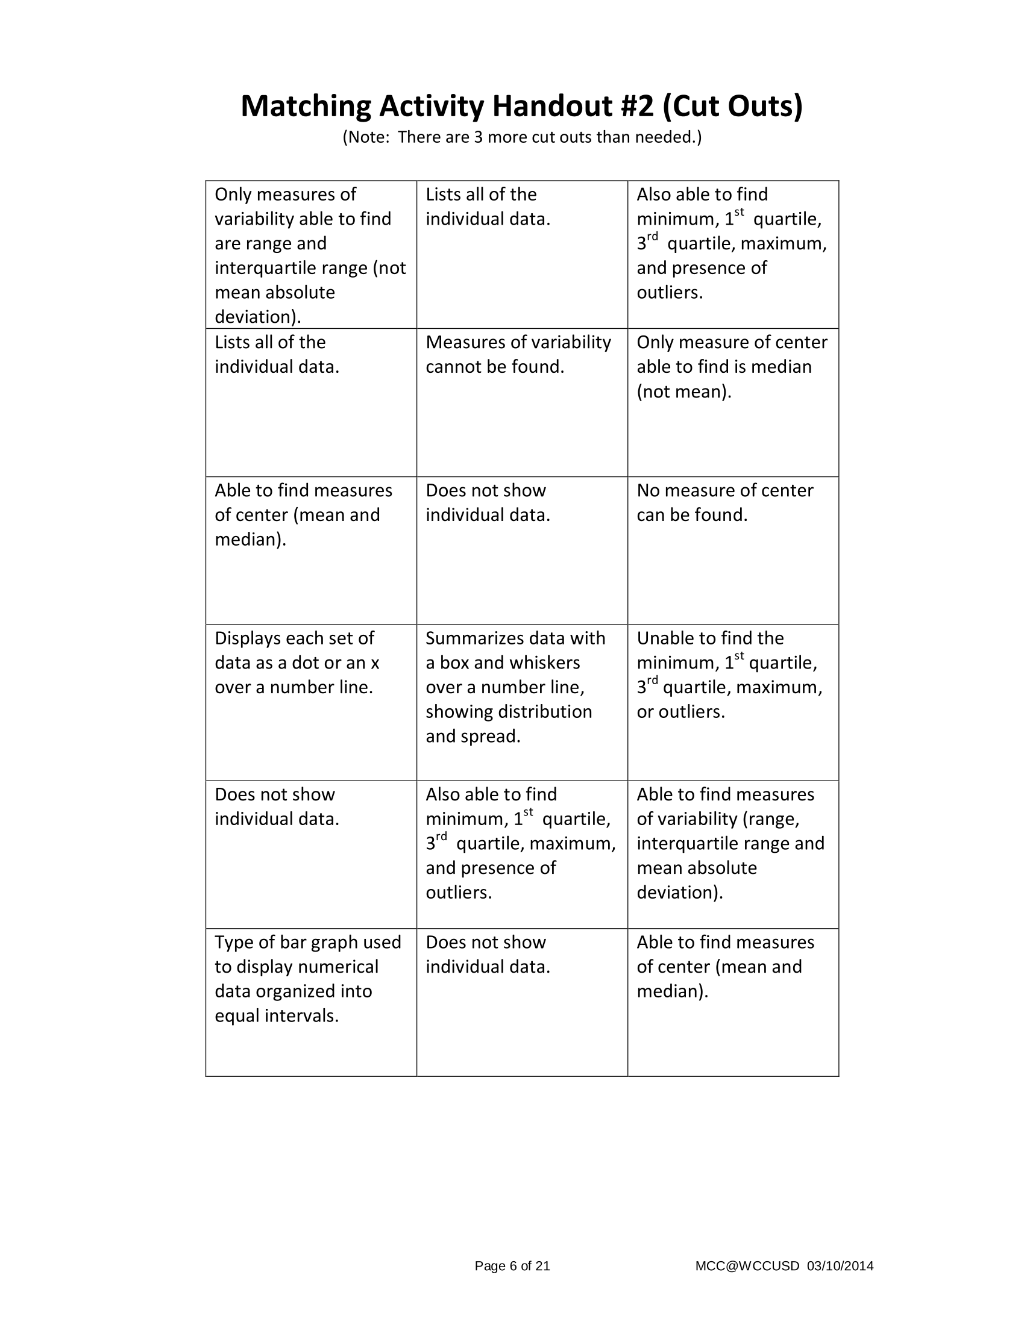
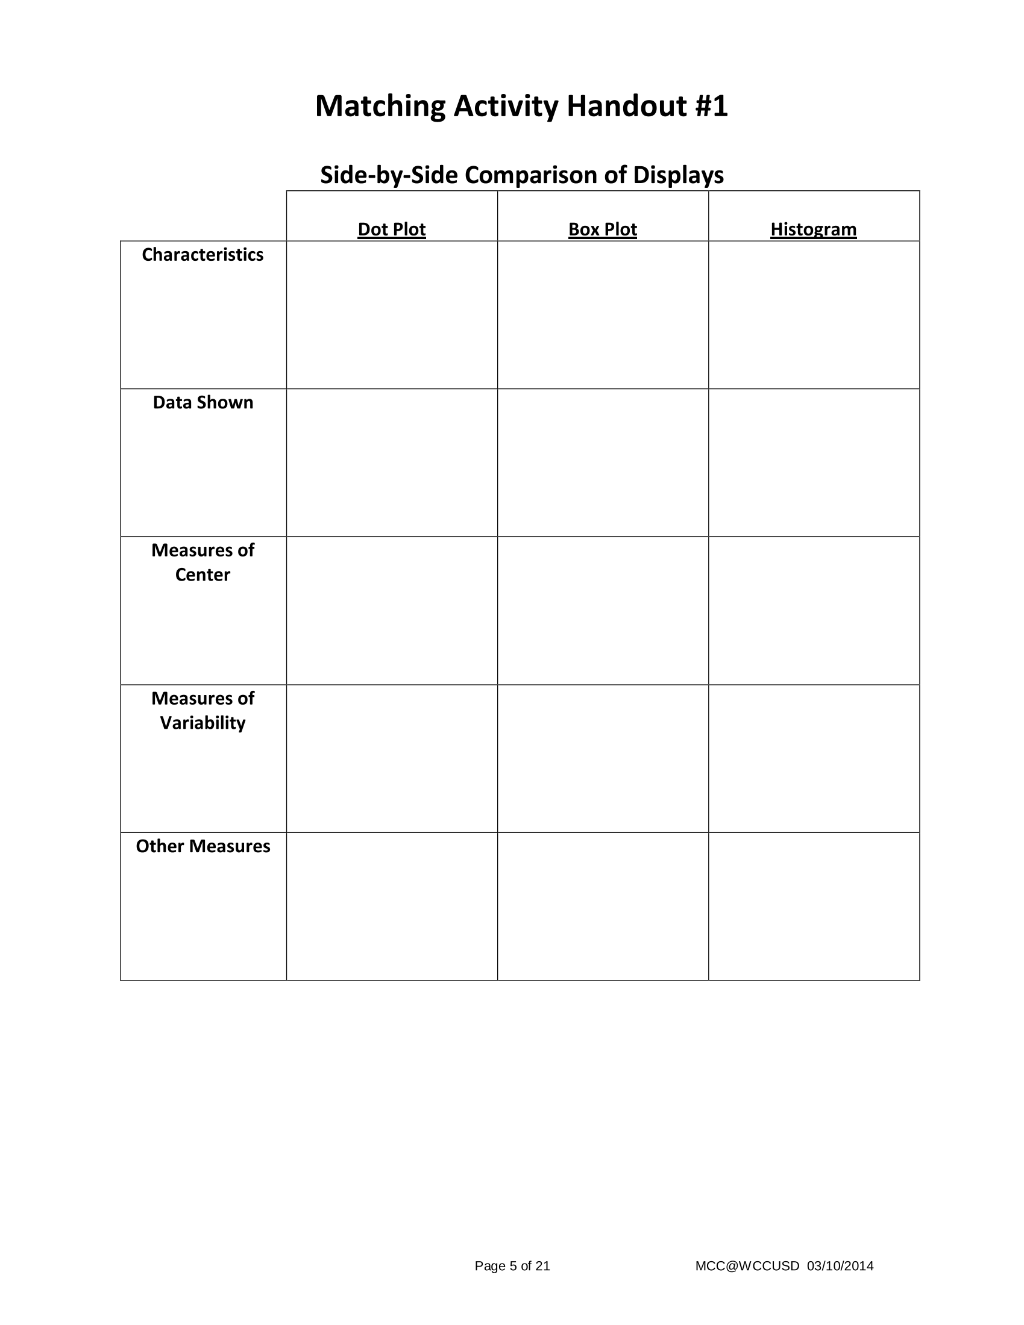
Dot Plot Box Plot Histogram Characteristics Displays each set of data as a dot or an x over a number line. showin Summarizes data with a box and whiskers over a number line, g distribution and spread. Type of bar graph used to display numerical data organized into equal intervals. Data Shown Lists all of the individual data Does not show
Preview 1
Preview 2
Preview 3
Preview 4
Preview 5
Preview 6