Preview 1
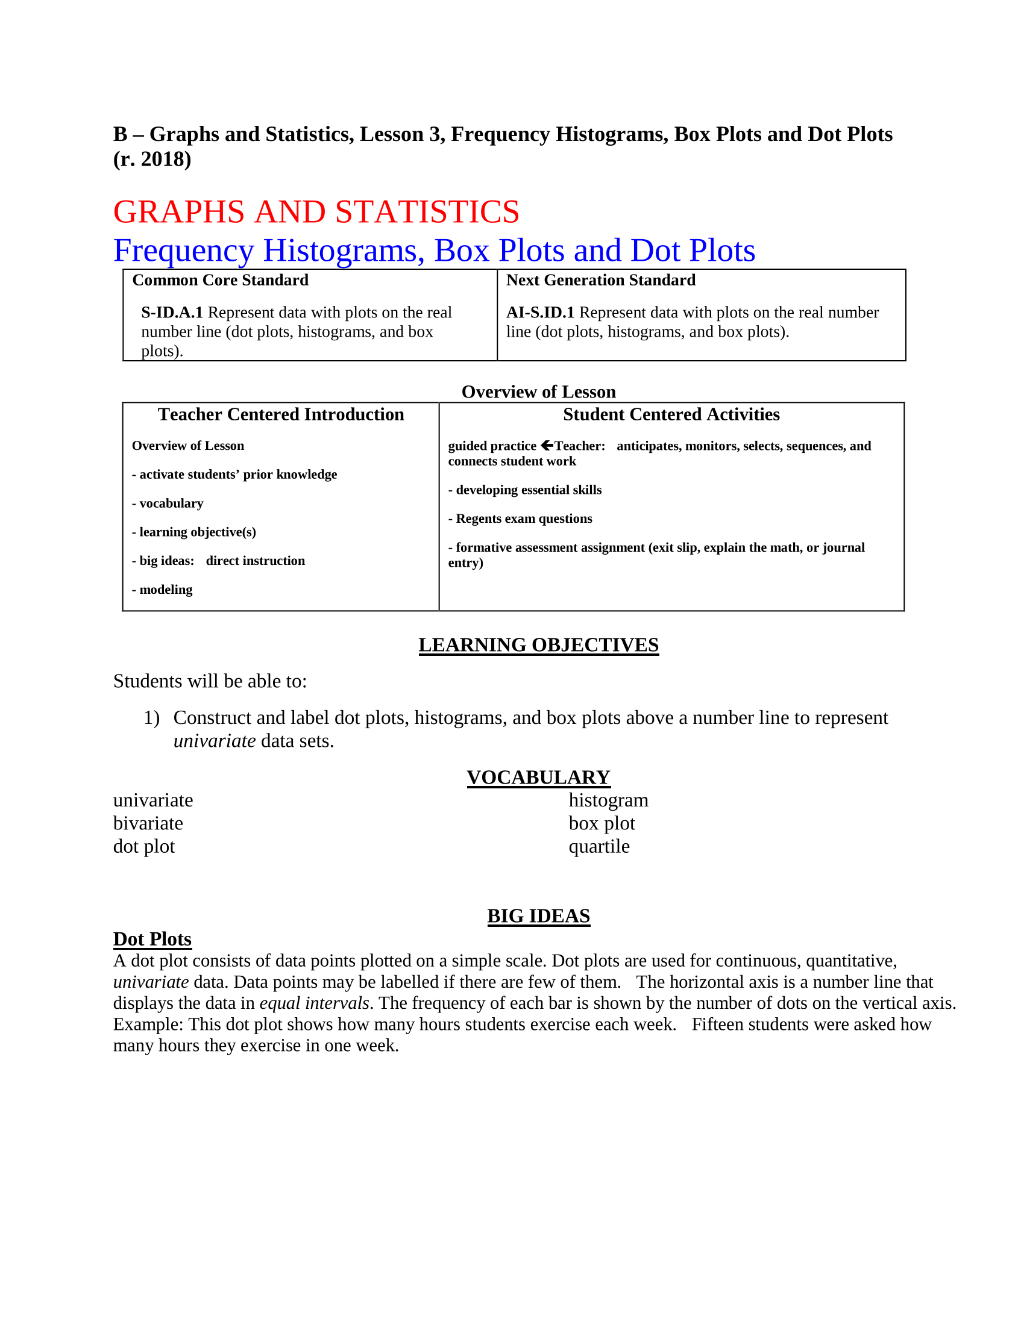
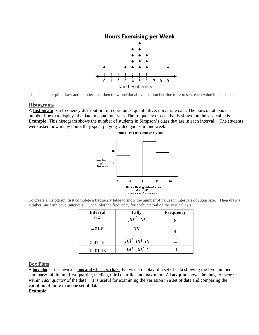
A dot plot consists of data points plotted on a simple scale. Dot plots are used for continuous, quantitative, univariate data. Data points may be labelled if there are few of them. The horizontal axis is a number line that displays the data in equal intervals. The frequency of each bar is shown by the number of dots on the vertical axis.
Preview 1
Preview 2
Preview 3
Preview 4
Preview 5
Preview 6