Preview 1

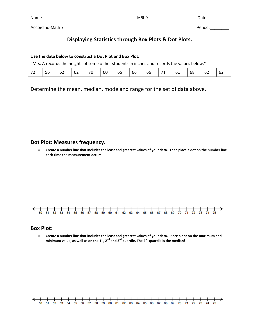
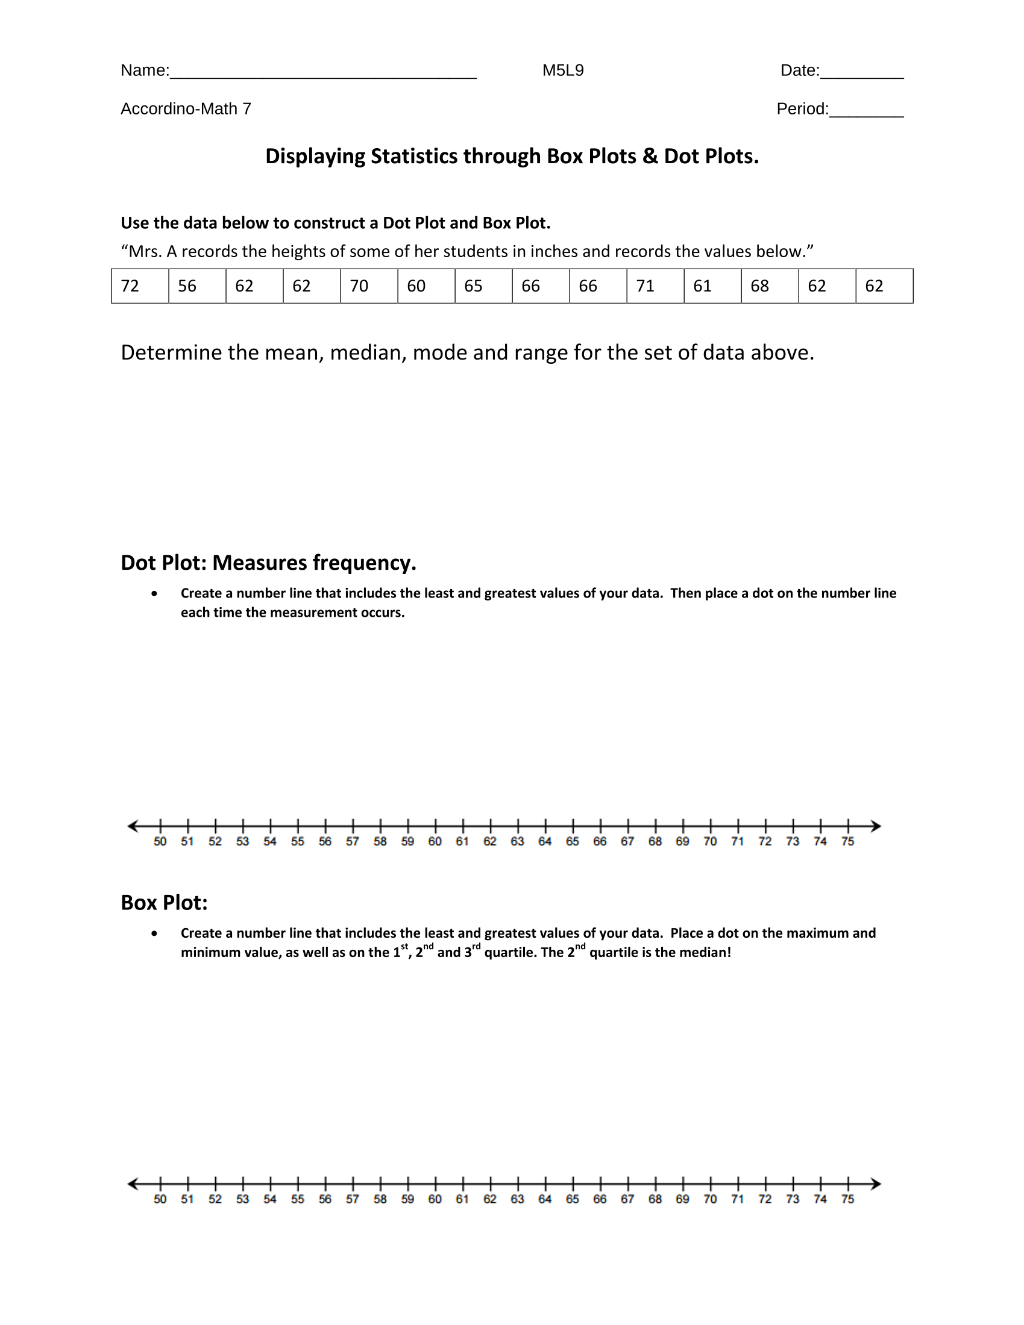
Displaying Statistics through Box Plots & Dot Plots. Use the data below to construct a Dot Plot and Box Plot. “Mrs. A records the heights of some of her students in inches and records the values below.” 72 56 62 62 70 60 65 66 66 71 61 68 62 62 Determine the mean, median, mode and range for the set of data above.
Preview 1
Preview 2
Preview 3
Preview 4
Preview 5
Preview 6