Preview 1
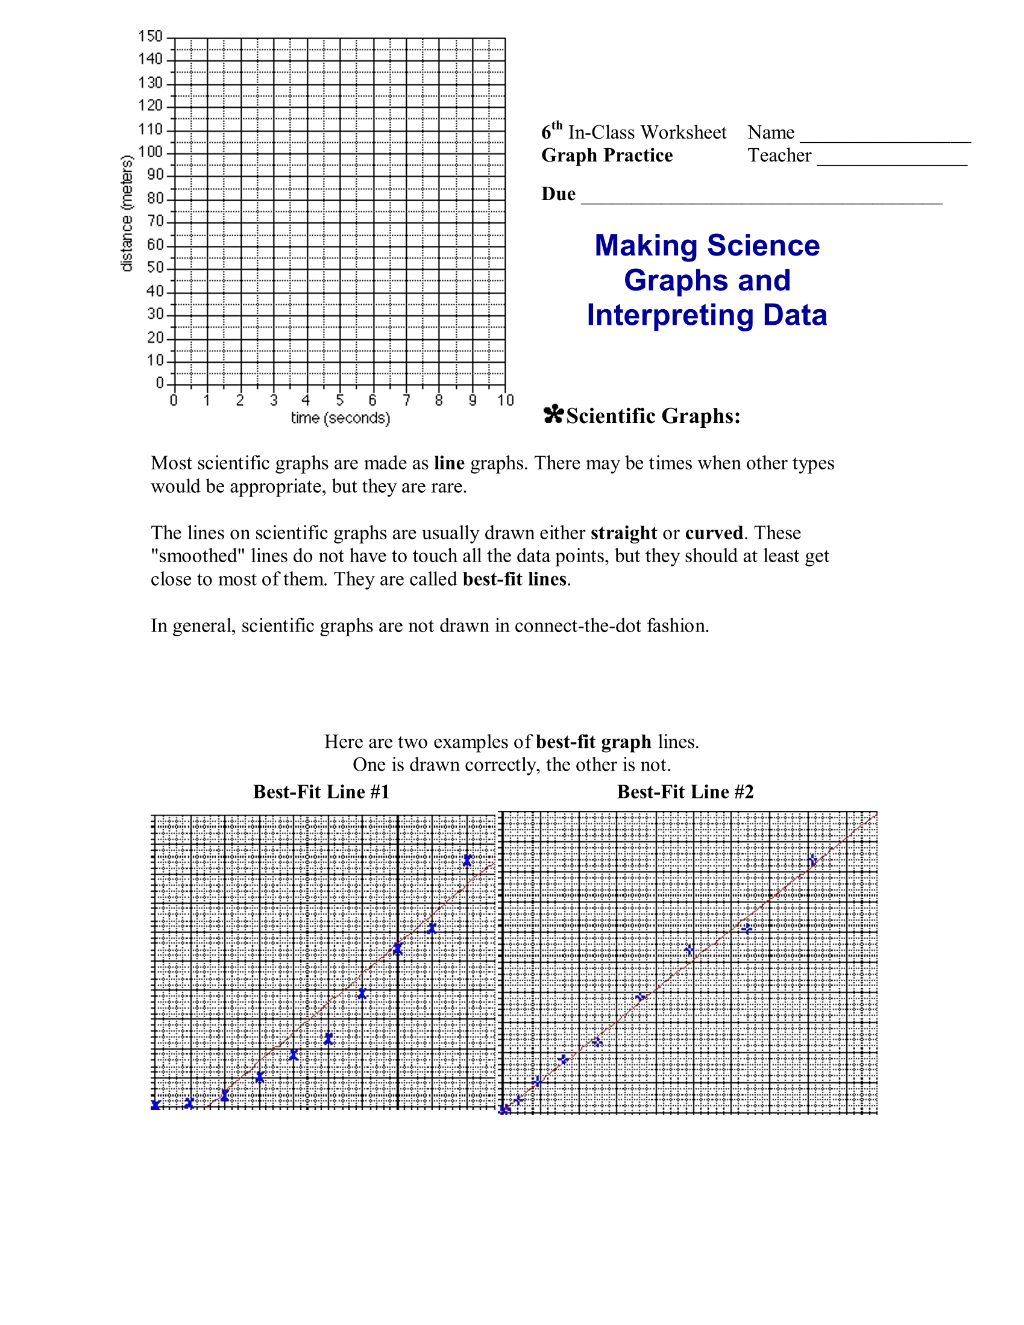
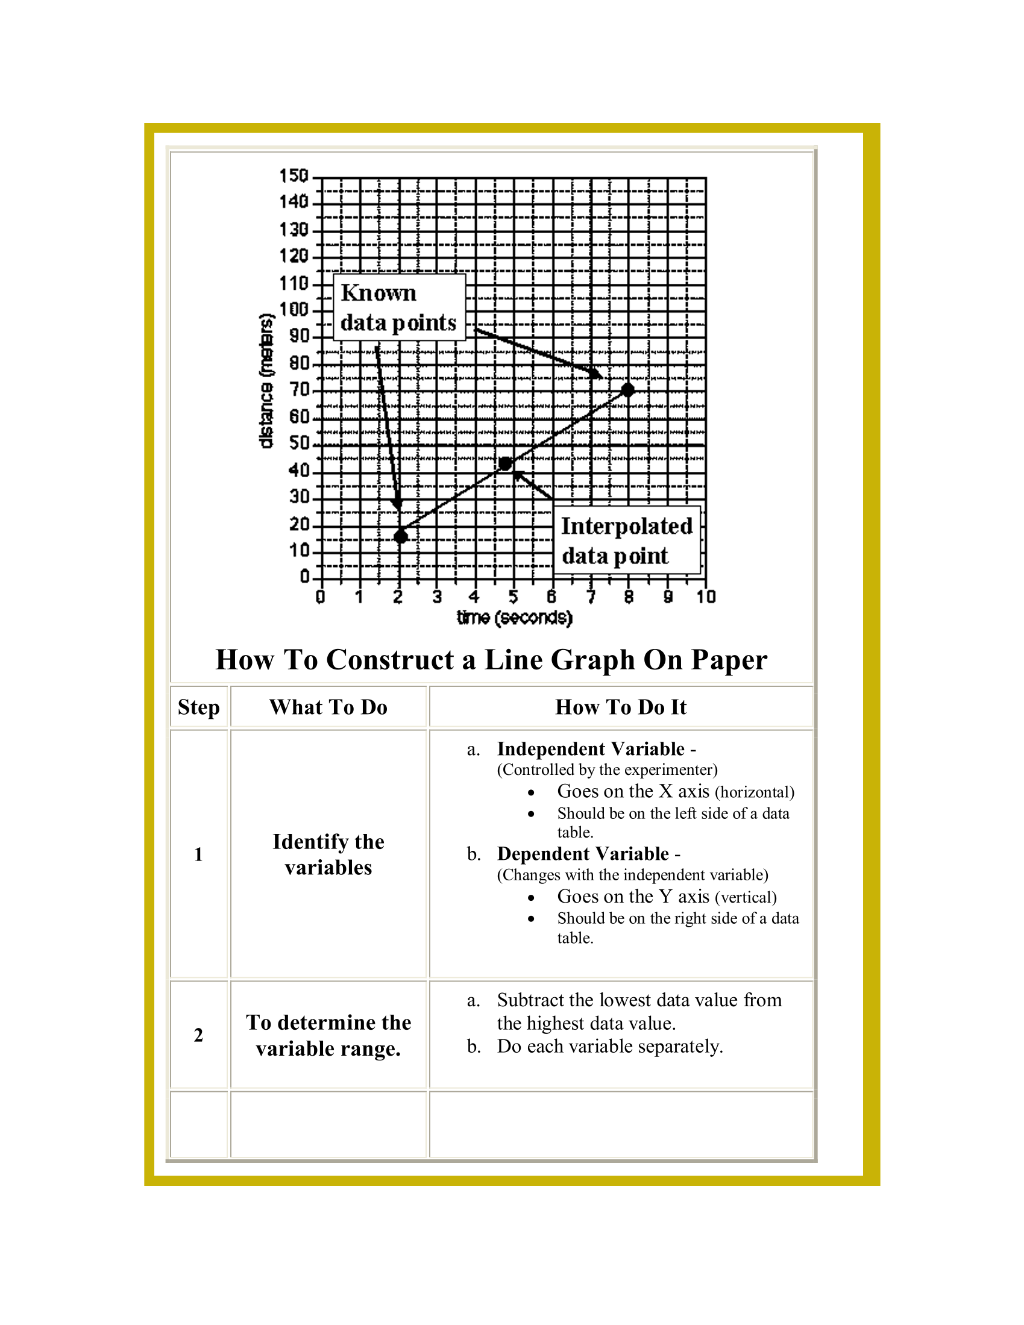
Graphing Practice – Problem 5 Time ( seconds ) Distance ( meters ) 0 0 1 2 2 8 3 18 4 32 5 50 6 72 7 98 8 128 9 162 10 200 A. Graph the data. Graphing Practice – Problem 6 The volume of a gas decreases as the temperature of the gas decreases. A sample of
Preview 1
Preview 2
Preview 3
Preview 4
Preview 5
Preview 6