Preview 1
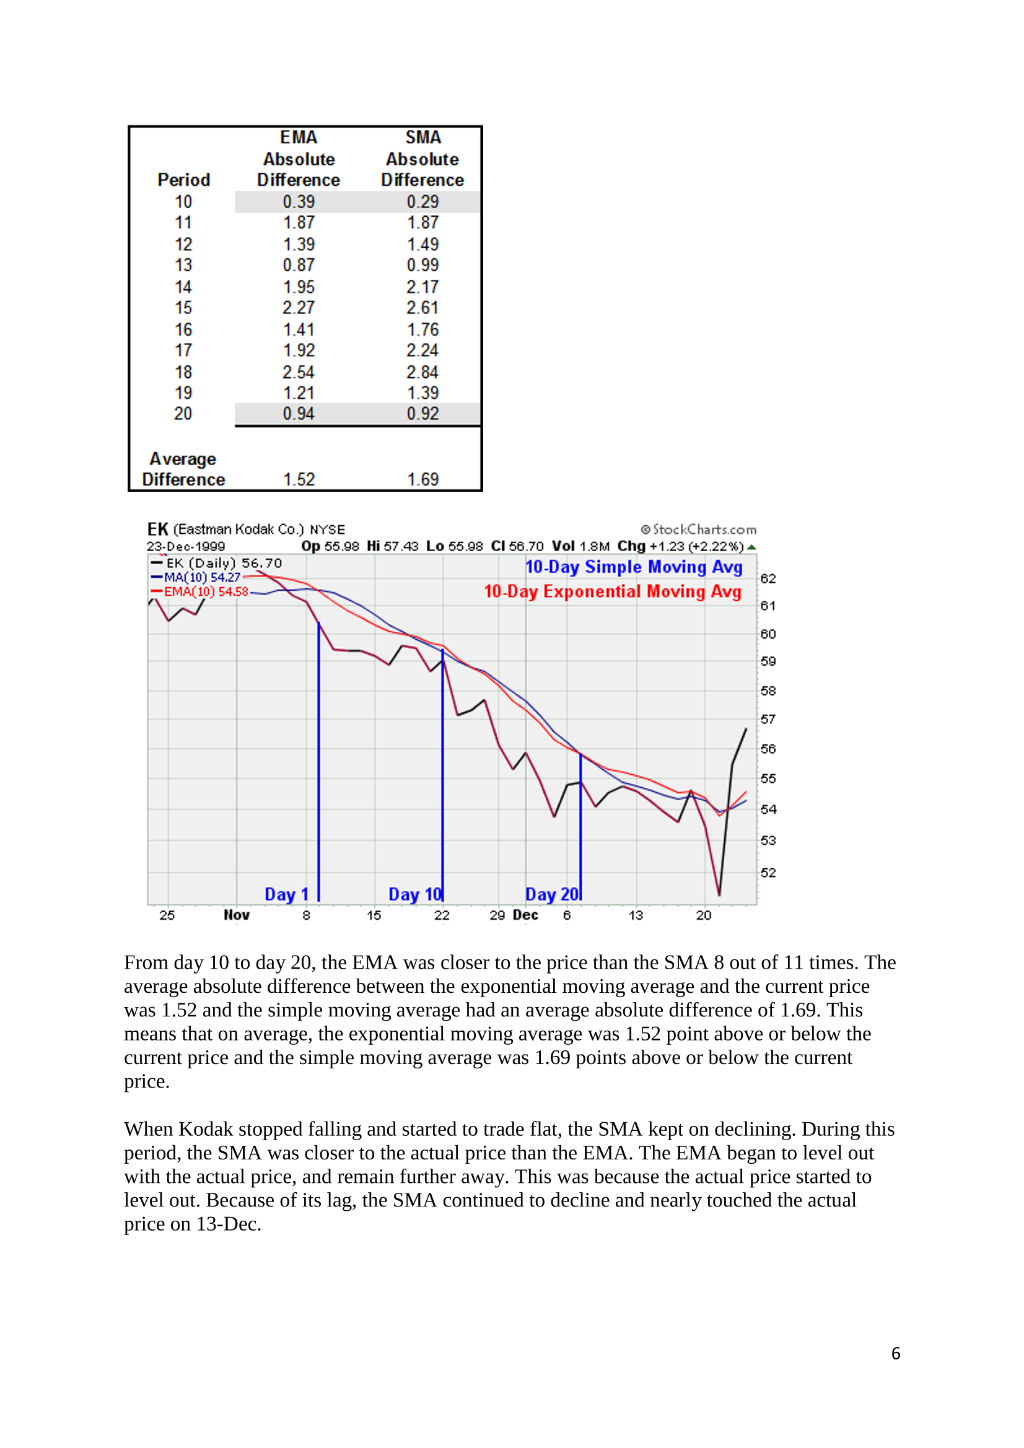
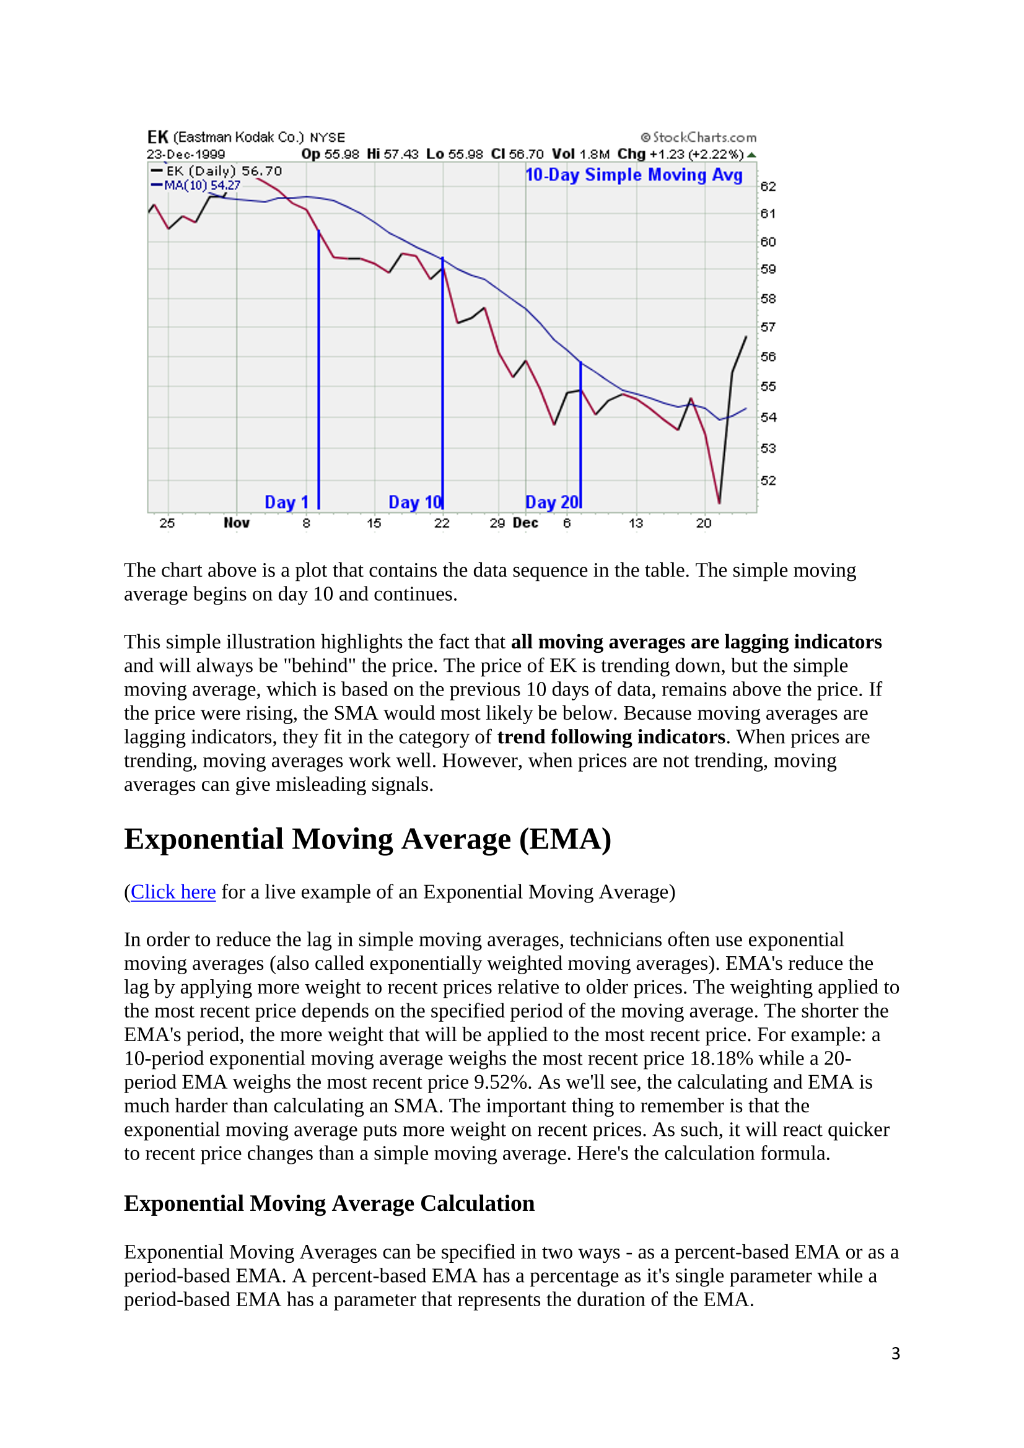
3 The chart above is a plot that contains the data sequence in the table. The simple moving average begins on day 10 and continues. This simple illustration highlights the fact that all moving averages are lagging indicators and will always be "behind" the price.
Preview 1
Preview 2
Preview 3
Preview 4
Preview 5
Preview 6