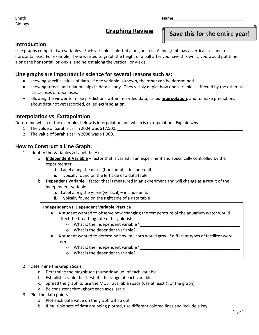
Preview 1
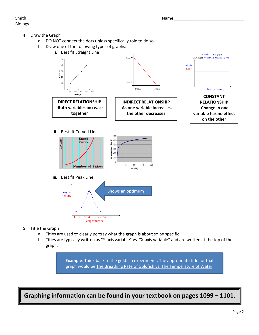
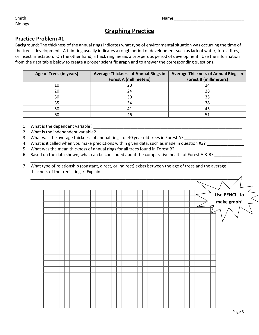
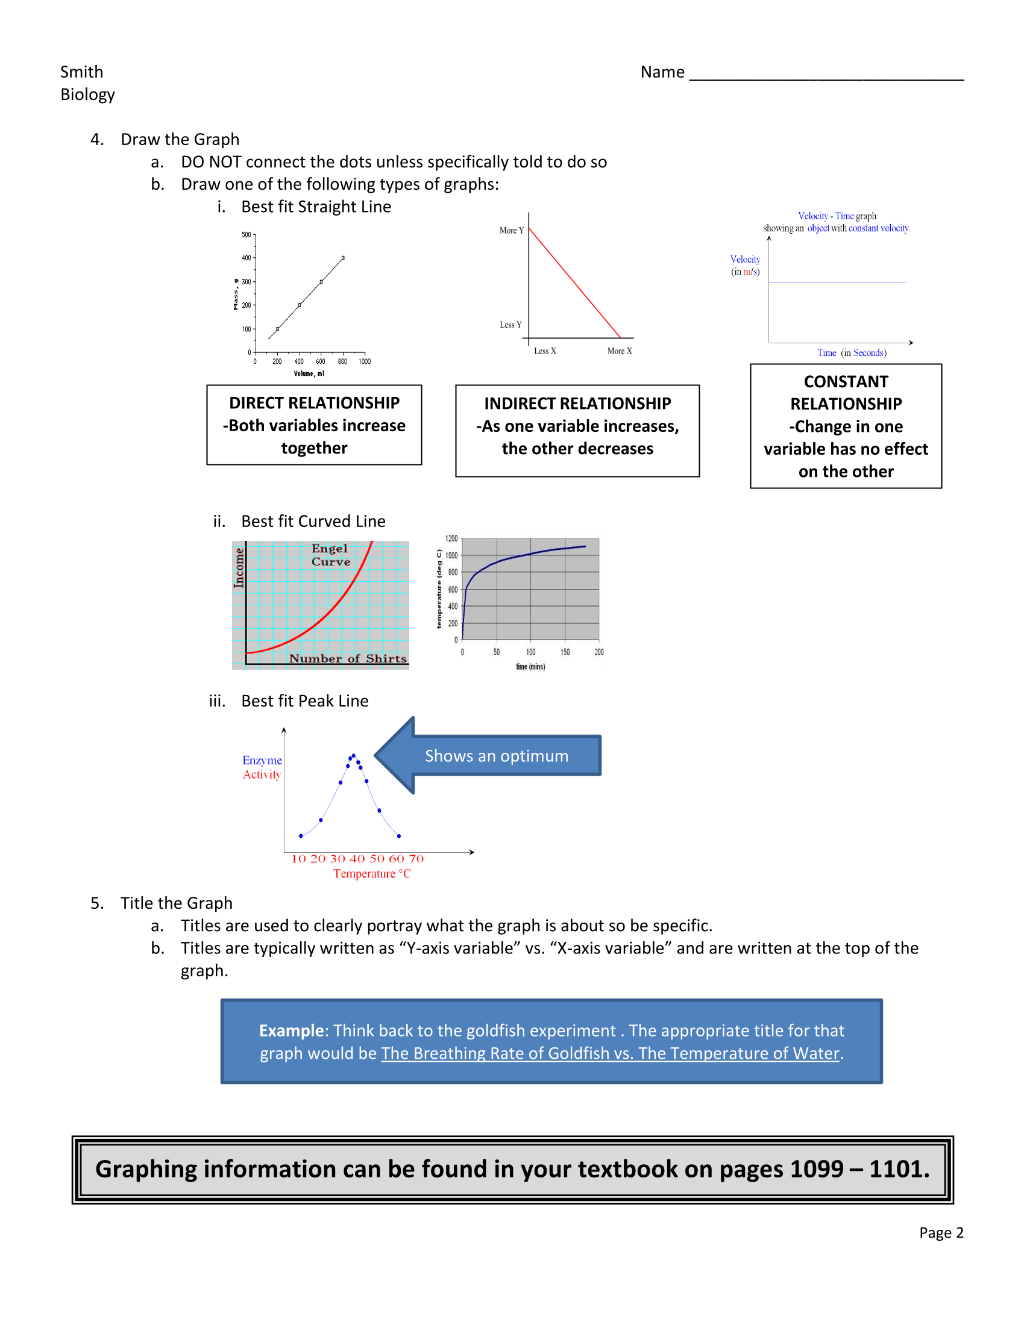
Line graphs are important in science for several reasons such as: showing specific values of data. If one variable is known, the other can be determined. showing trends and relationships in data clearly. They visibly depict how one variable is affected by the other as it increases or decreases.
Preview 1
Preview 2
Preview 3
Preview 4
Preview 5
Preview 6