Preview 1

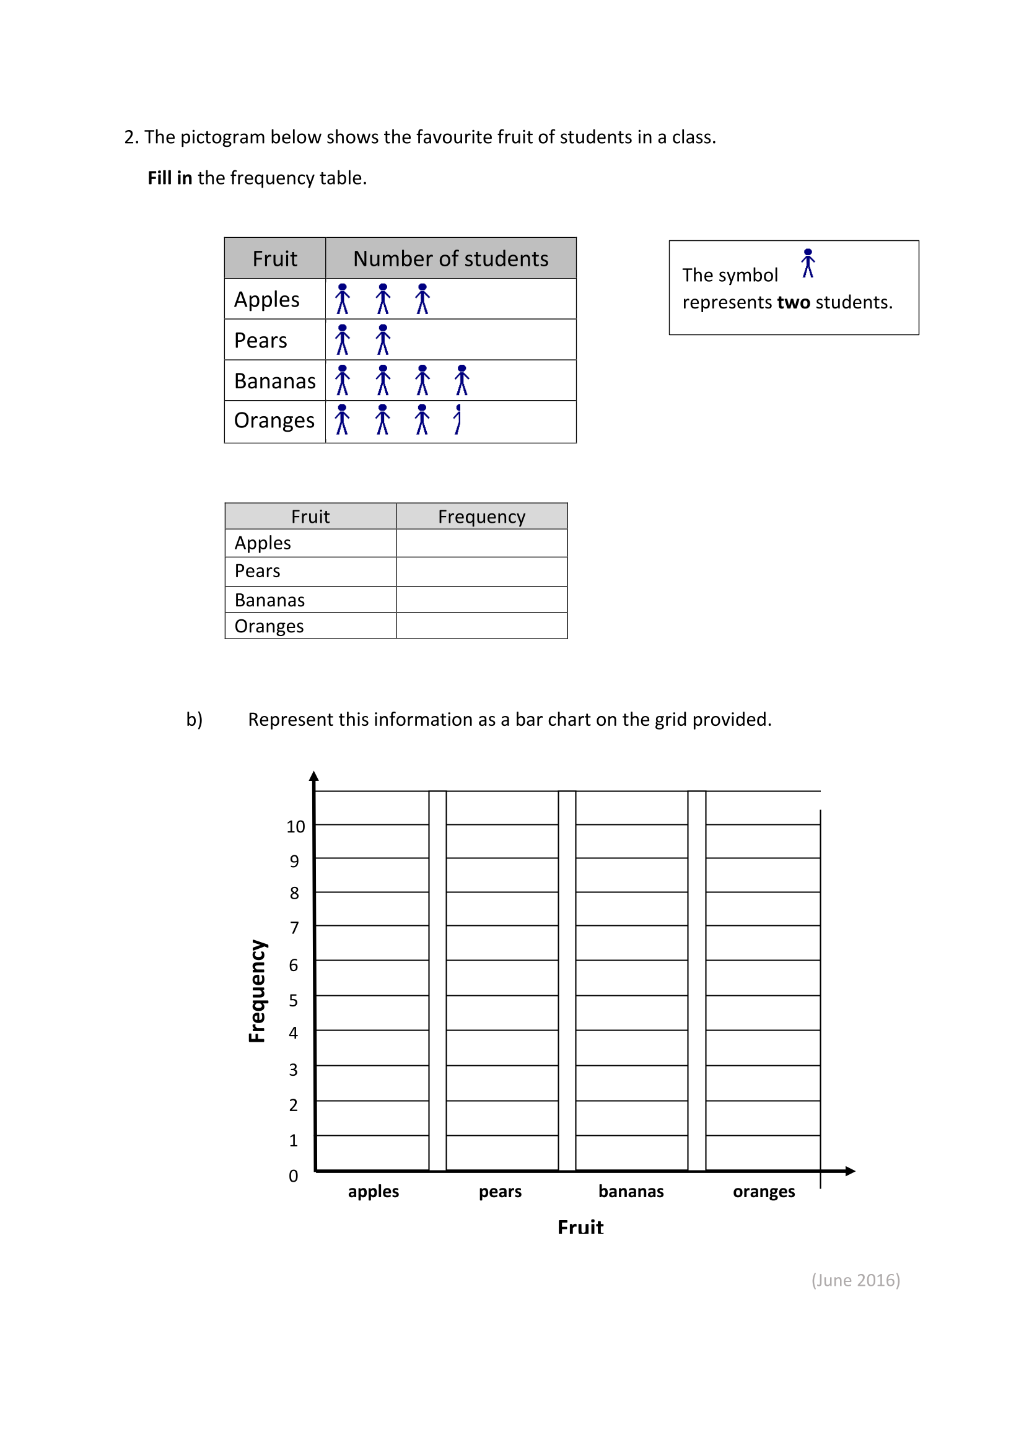
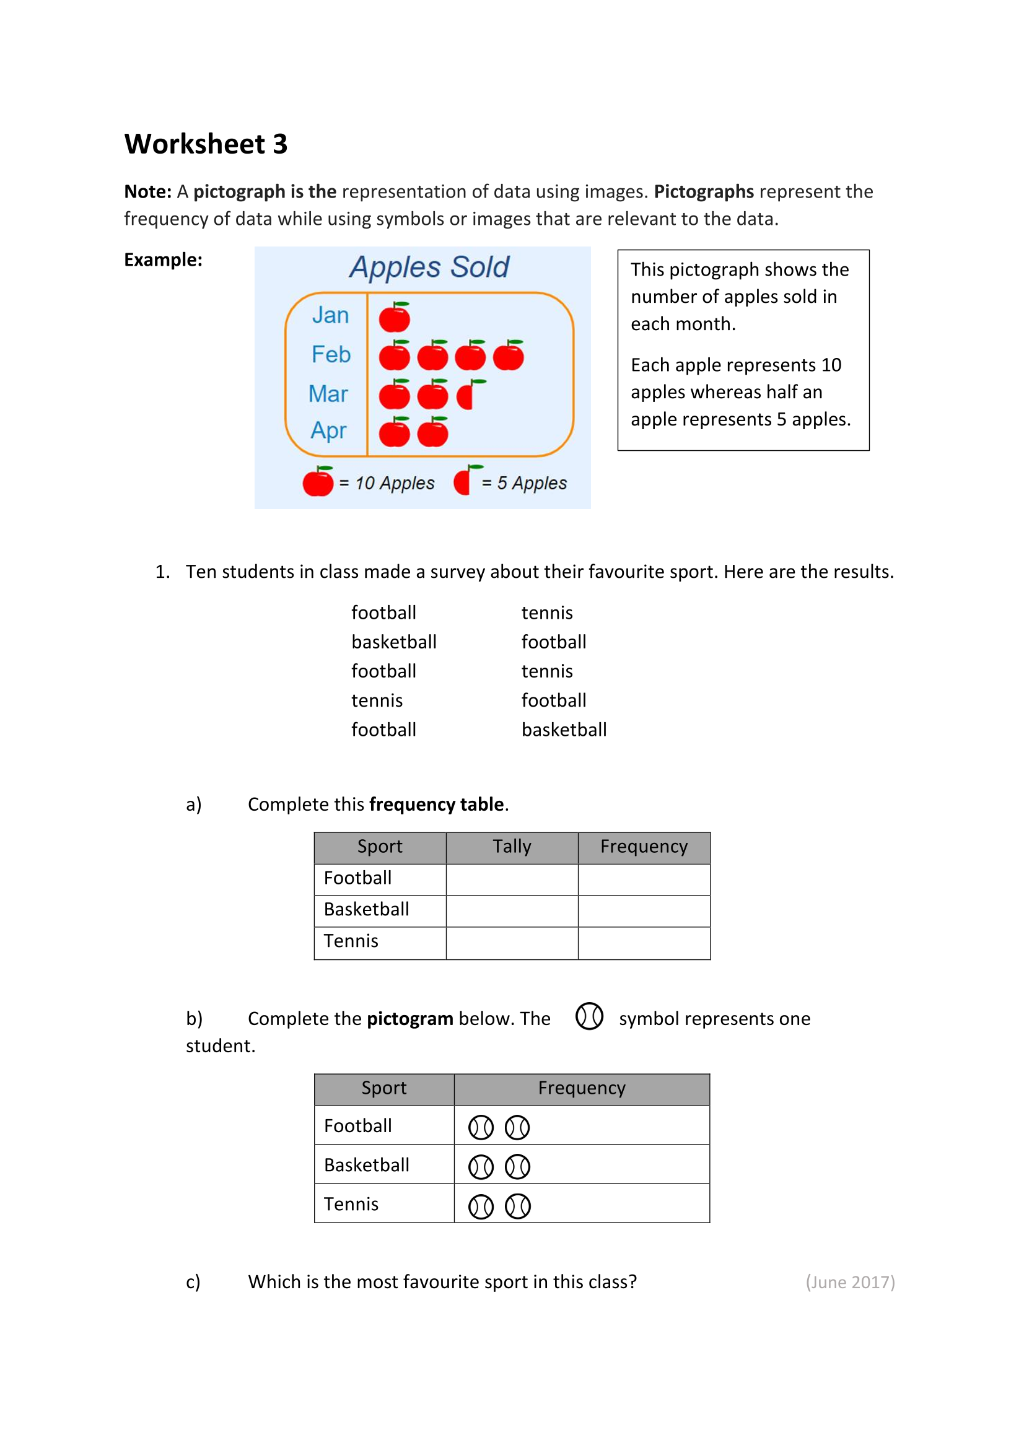
Worksheet 3 Note: A pictograph is the representation of data using images.Pictographs represent the frequency of data while using symbols or images that are relevant to the data. Example: 1. Ten students in class made a survey about their favourite sport.
Preview 1
Preview 2
Preview 3
Preview 4
Preview 5
Preview 6