Preview 1
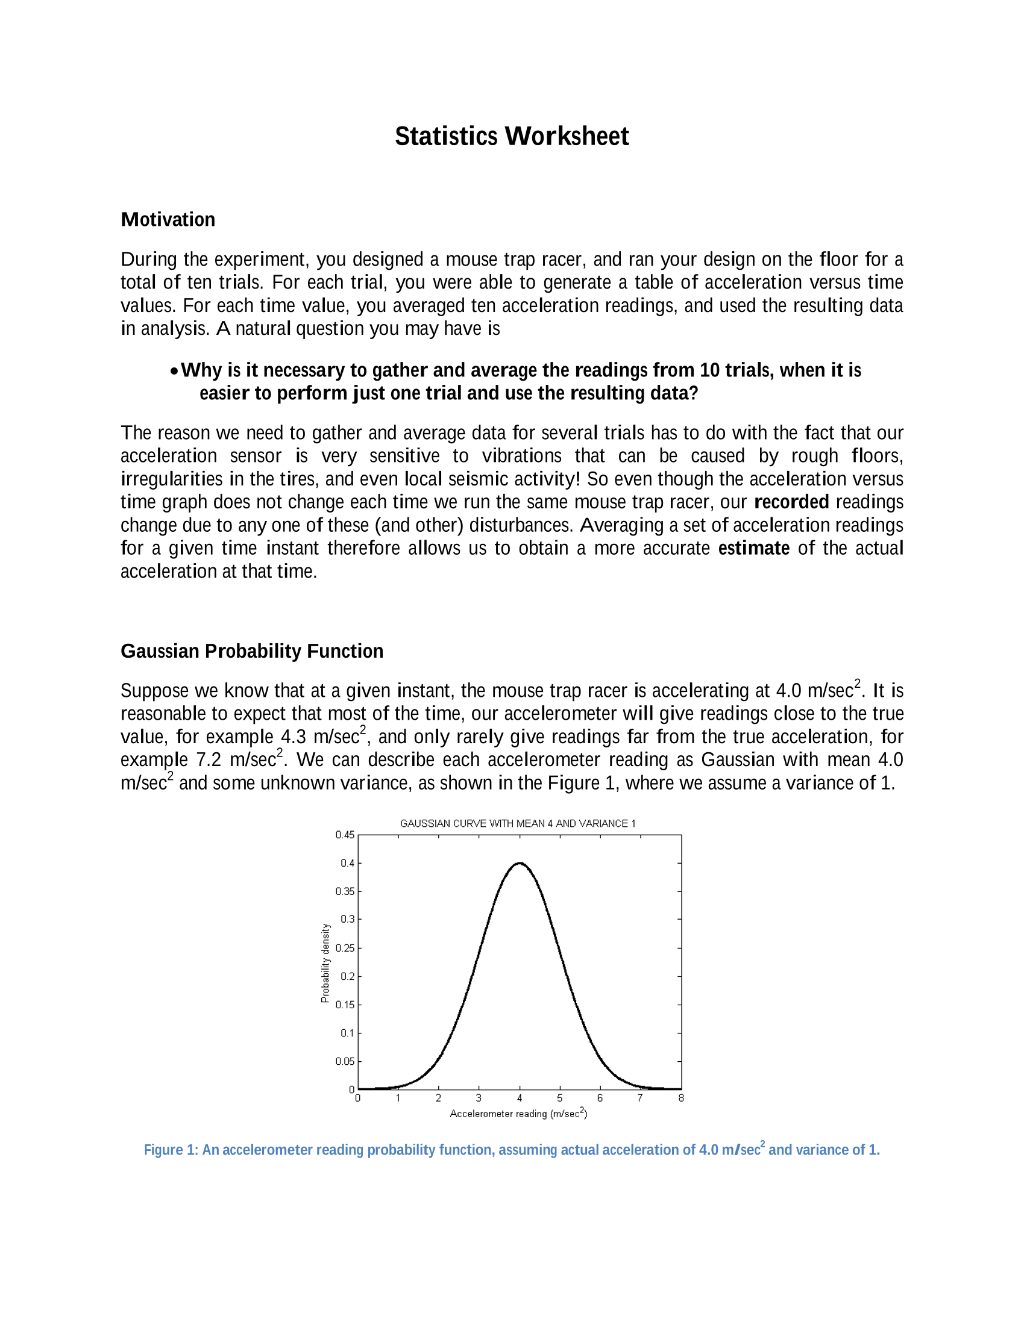
Statistics Worksheet Motivation During the experiment, you designed a mouse trap racer, and ran your design on the floor for a total of ten trials. For each trial, you were able to generate a table of acceleration versus time values. For each time value, you averaged ten acceleration readings, and used the resulting data in analysis.
Preview 1
Preview 2
Preview 3
Preview 4
Preview 5

Preview 6