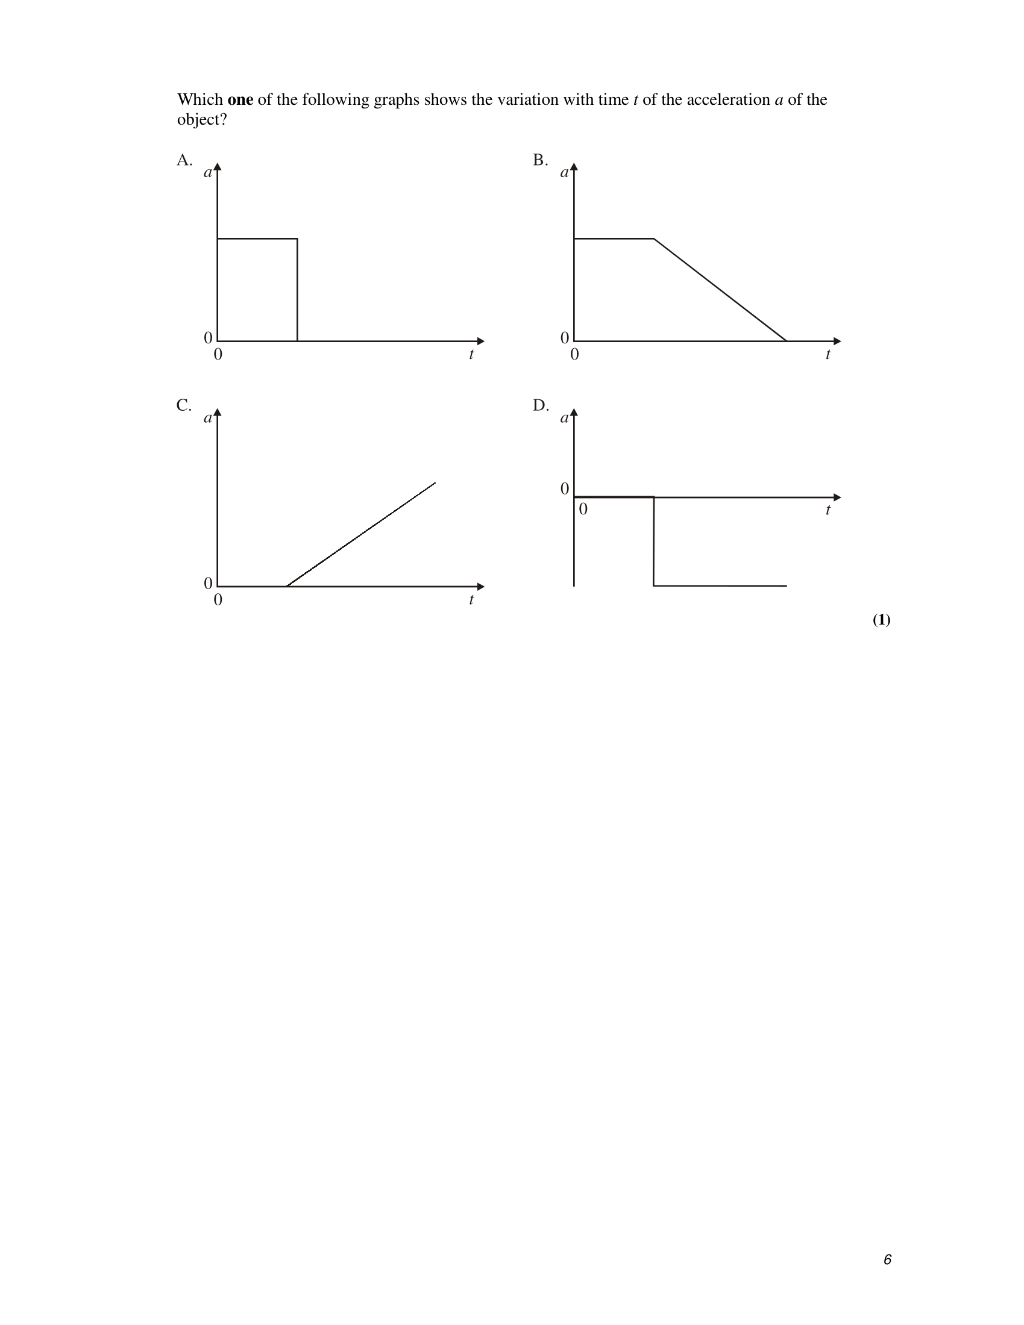
Preview 1
8 10. The graph below shows the variation with time t of the acceleration a of a spaceship. The spaceship is at rest at t = 0. The shaded area represents A. the distance travelled by the spaceship between t = 0 and t = T. B. the speed of the spaceship at t = T. C. the rate at which the speed of the spaceship changes between t = 0 and t = T. D. the rate at which the acceleration changes between ...
Preview 1
Preview 2
Preview 3
Preview 4
Preview 5
Preview 6