Preview 1
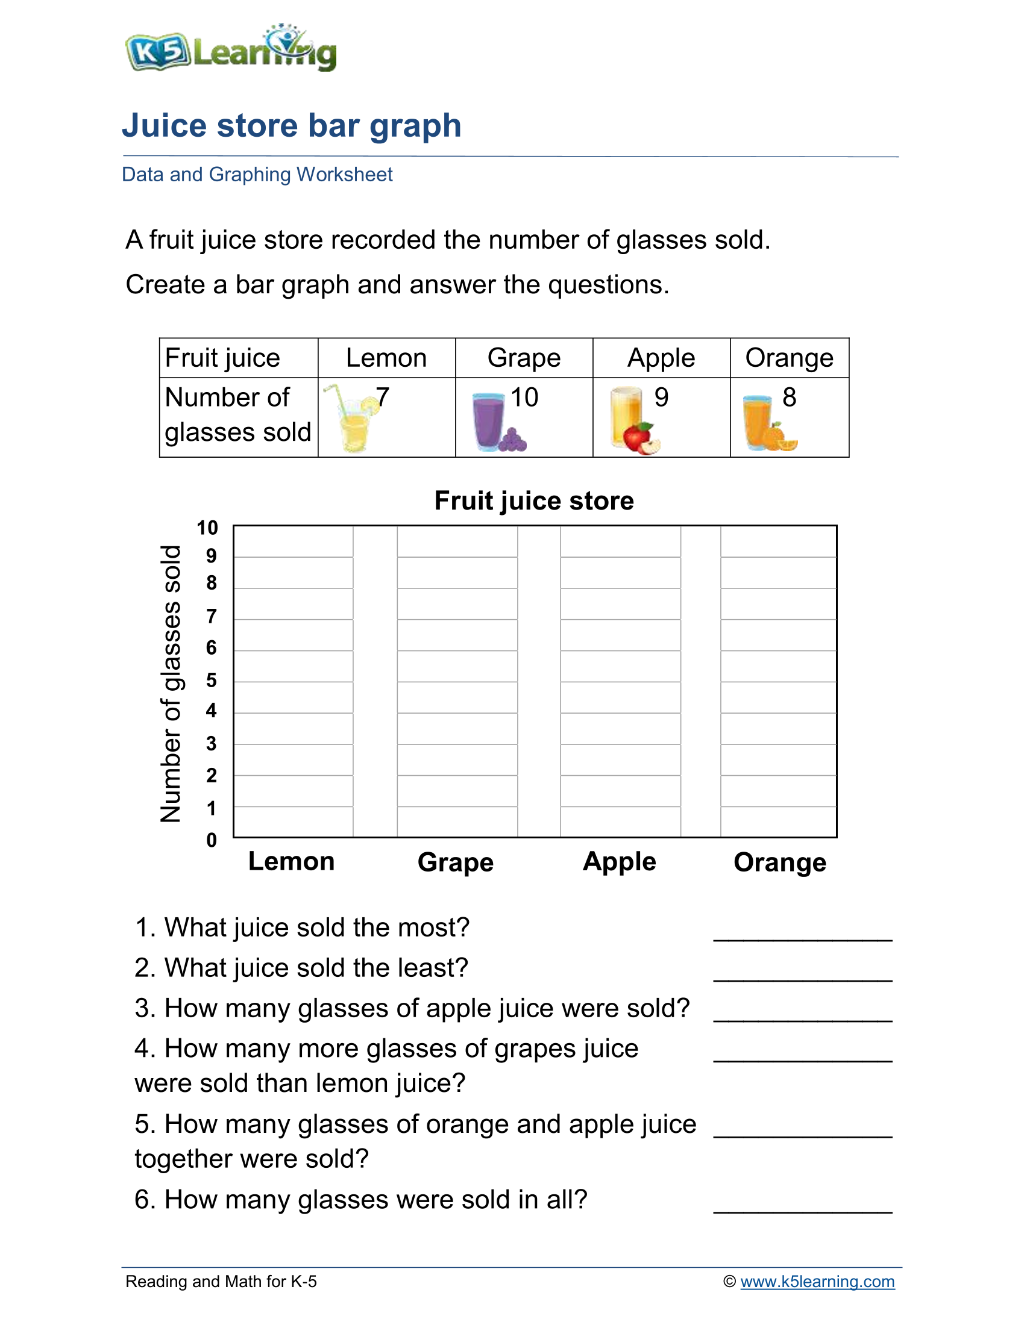
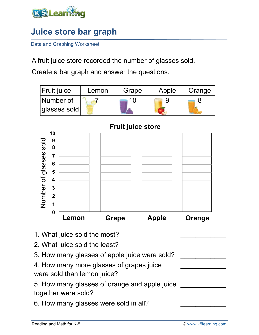
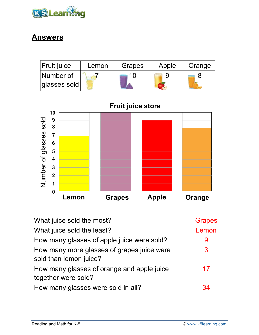
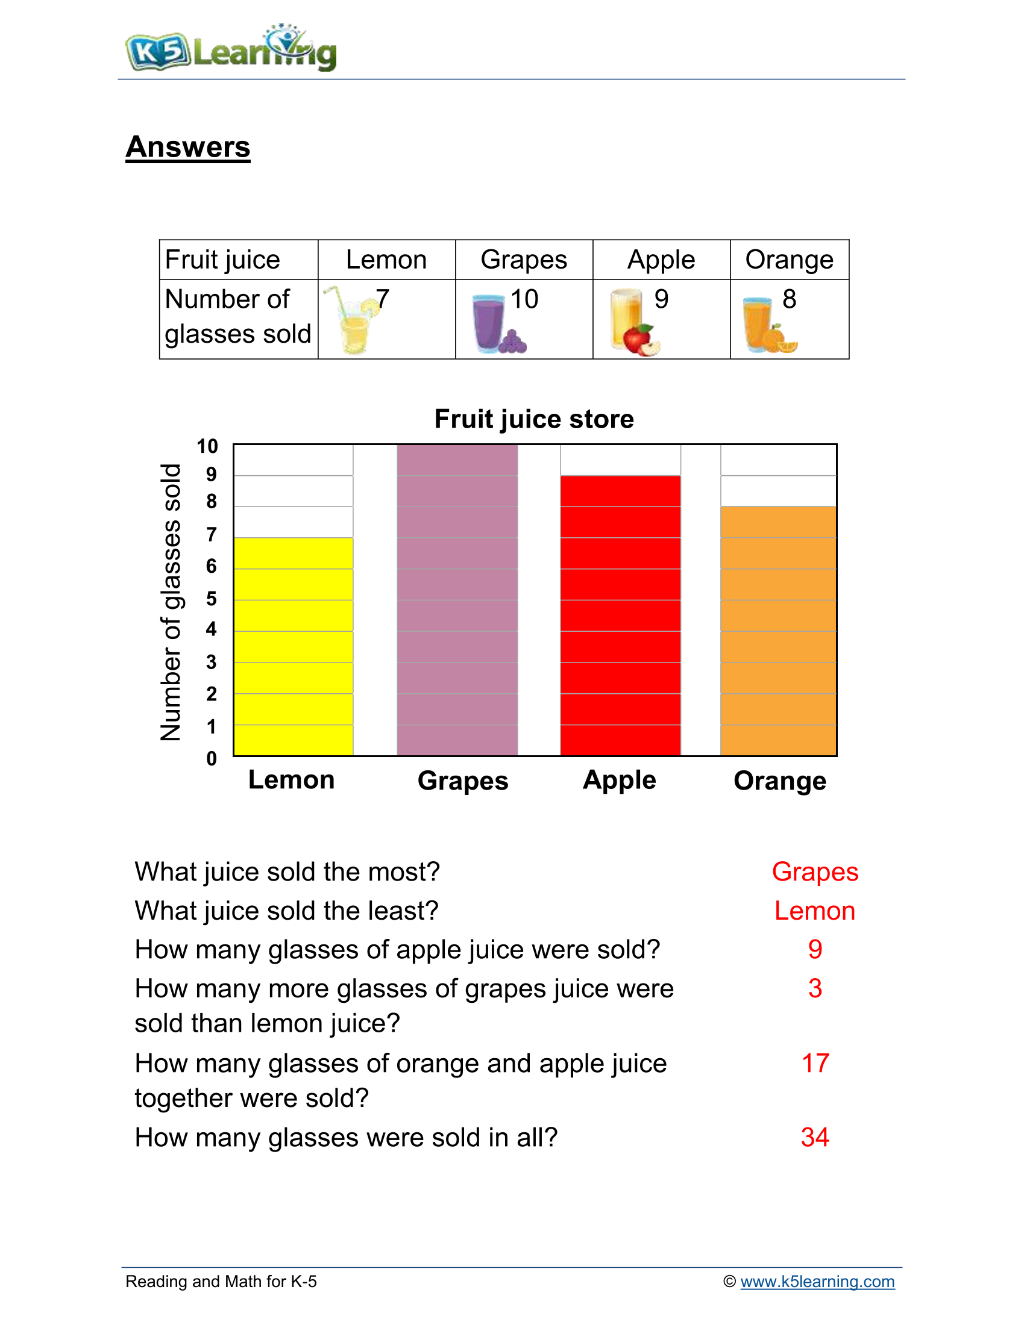
Juice store bar graph Data and Graphing Worksheet Fruit juice Lemon Grape Apple Orange Number of 7 10 9 8 glasses sold A fruit juice store recorded the number of glasses sold. Create a bar graph and answer the questions. 0 2 1 3 4 5 6 Fruit juice store d 1. What juice sold the most? _____ 2. What juice sold the least?
Preview 1
Preview 2
Preview 3

Preview 4

Preview 5

Preview 6