Preview 1
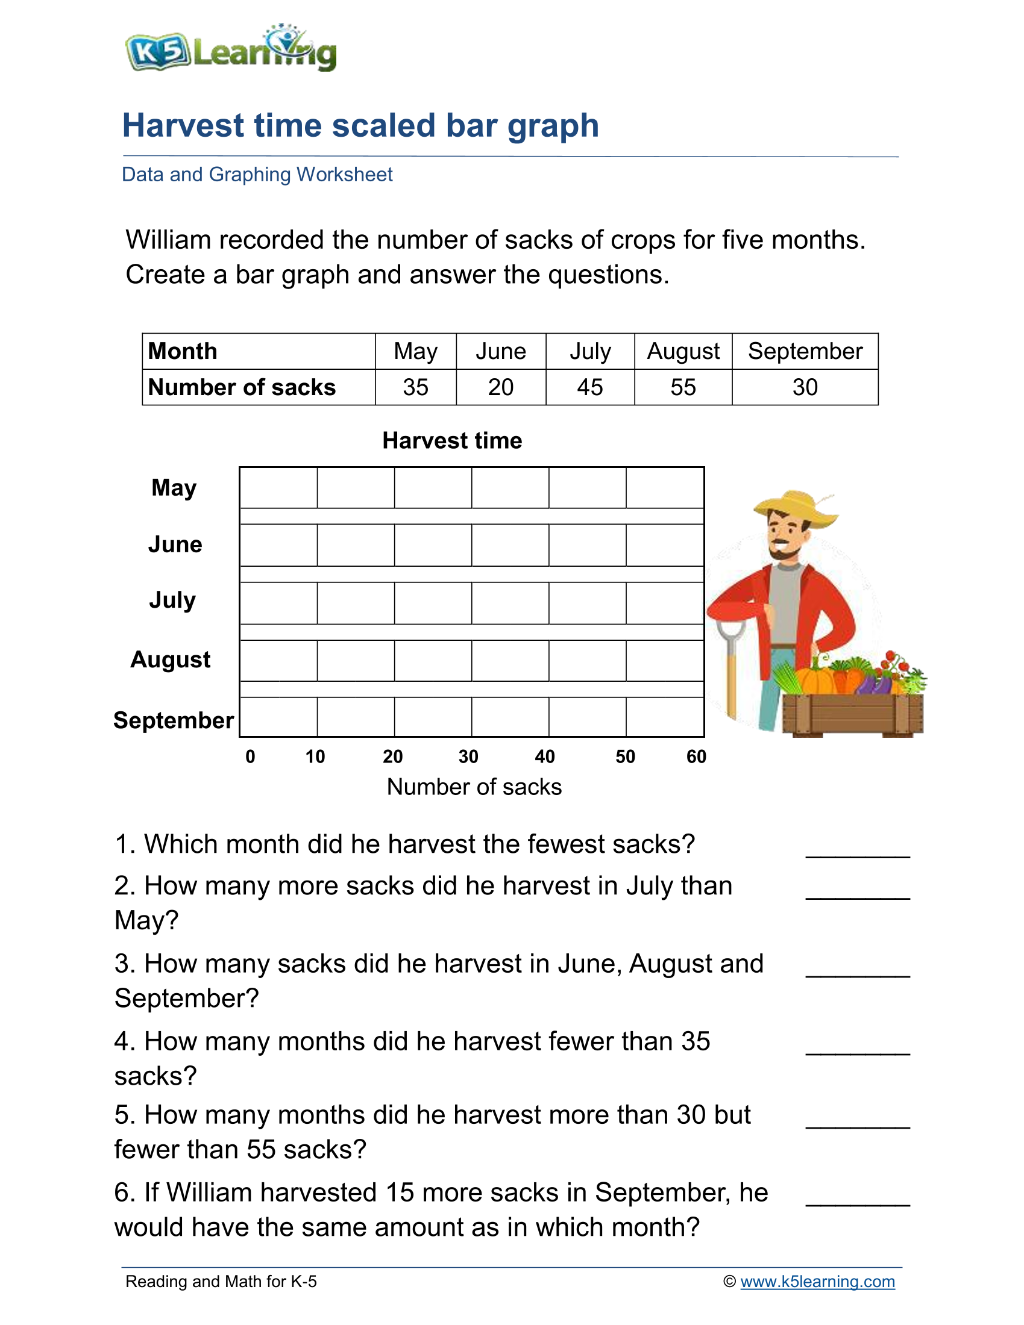
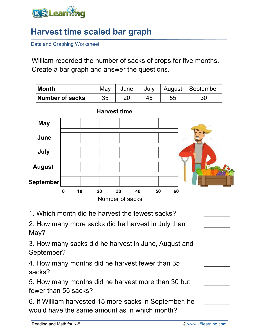
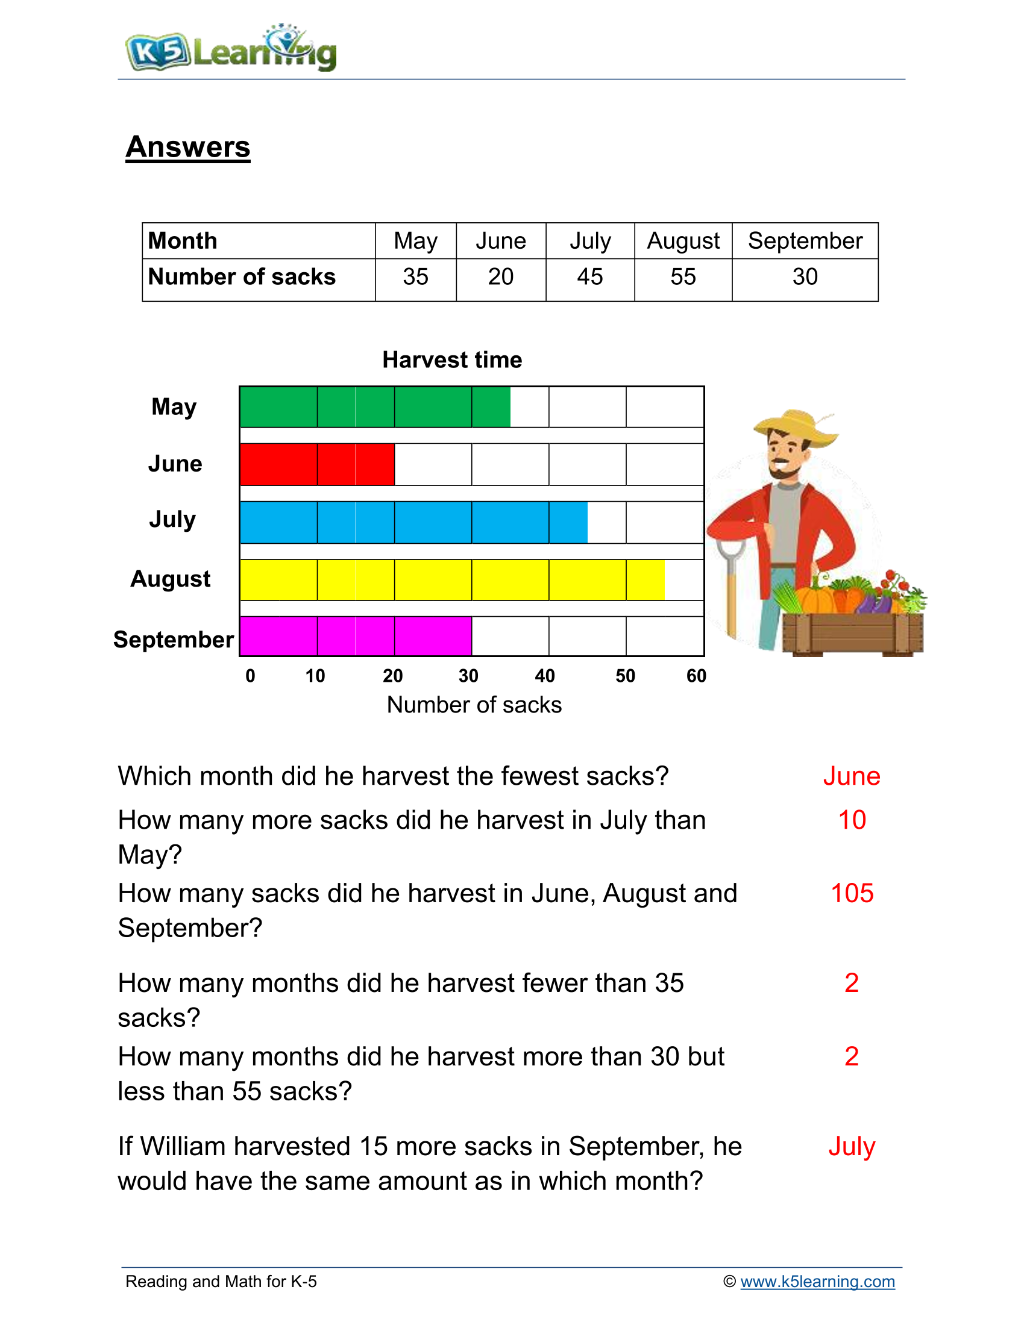
Harvest time scaled bar graph Data and Graphing Worksheet Month May June July August September Number of sacks 35 20 45 55 30 William recorded the number of sacks of crops for five months. Create a bar graph and answer the questions. 0 10 20 30 40 50 60 Harvest time September Number of sacks 1. Which month did he harvest the fewest sacks?
Preview 1
Preview 2
Preview 3

Preview 4

Preview 5

Preview 6